Abstract
There are several payment mechanisms under ACO REACH, one of which is Primary Care Capitation (PCC). This is the payment mechanism through which most primary care providers will be reimbursed. PCC applies only to Evaluation and Management (E&M) services provided to aligned beneficiaries and replaces some or all of a provider’s E&M fee-for-service (FFS) revenue. Providers will continue to receive FFS payment for non-primary care services outside the scope of the PCC payment.
As a primary care provider, you may be wondering: What portion of my FFS revenue can be attributed to E&M services?
We break down total FFS revenue along various dimensions below.
Key Findings
- On average, across the U.S., about 71% of total FFS revenue will be replaced by PCC in ACO REACH.
- The portion of total FFS revenue replaced by PCC in ACO REACH will vary by region: Northeast (76.02%), Midwest (72.27%), West (69.74%), South (68.50%).
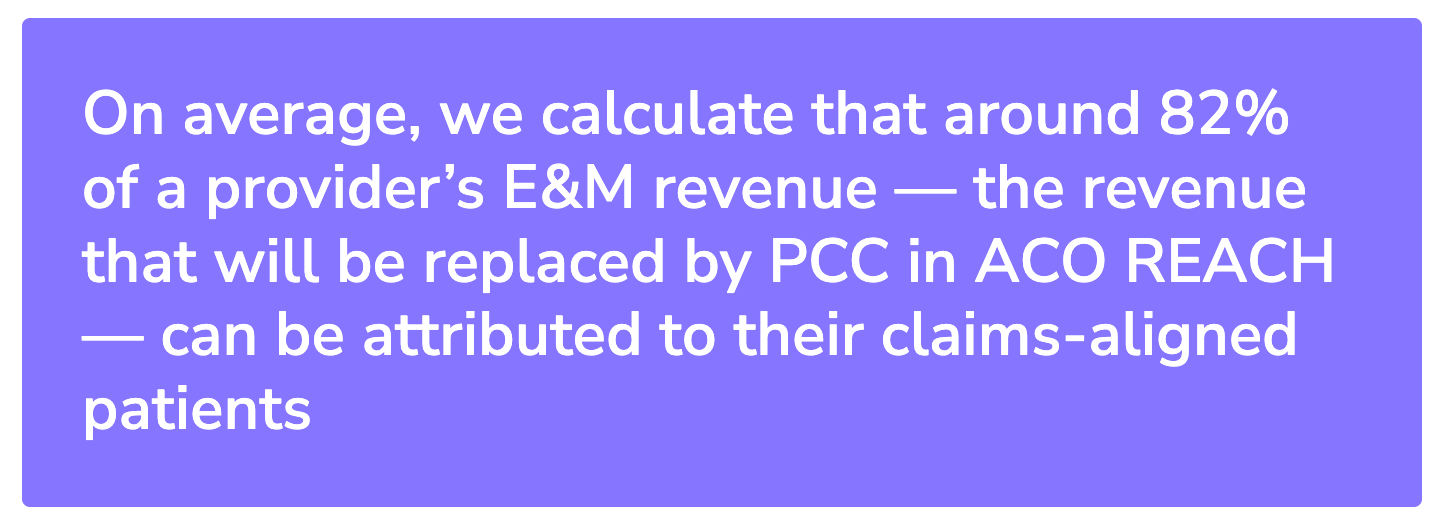
- On average, around 82% of a provider’s E&M revenue can be attributed to their claims-aligned patients; since PCC only covers E&M services performed for aligned patients, if patients who are not claims-aligned to a provider choose to voluntarily align, it could boost that provider’s PCC revenue by about 22% under ACO REACH.
- On average, around 42% of E&M spend for patients claims-aligned to a provider originates from that provider; if claims-aligned patients choose to receive all or the majority of E&M services from their aligned provider, that would increase the provider’s PCC revenue in the following year.

Data
First, since PCC only applies to E&M services, we need to understand what qualifies as an E&M service in order to calculate how much FFS revenue will be replaced by PCC in ACO REACH.
Below is a summary of some of the most commonly billed E&M service codes that are included in PCC for ACO REACH.
Table 1: Most commonly used E&M services and billing codes
Notes: For a comprehensive list, please see the Global and Professional Direct Contracting Model Financial Operating Guide Overview (pages 39-43).
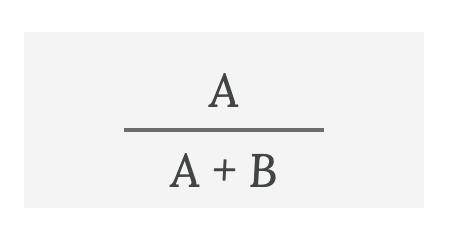
Second, we must define the E&M rate, using the ratio below:

We computed the E&M rate along several dimensions using the Medicare Physician & Other Practitioners by Provider and Service 2019 Public Use File (henceforth referred to as the “Medicare PUF”) and present our findings below. We focus on the E&M rate in non-facility settings only, as non-facilities are typically primary care offices, whereas facilities include hospitals, skilled nursing facilities, hospice care, and other settings where specialty services that are not attributable to primary care are performed.
Findings
Portion of Total FFS Revenue Replaced by PCC

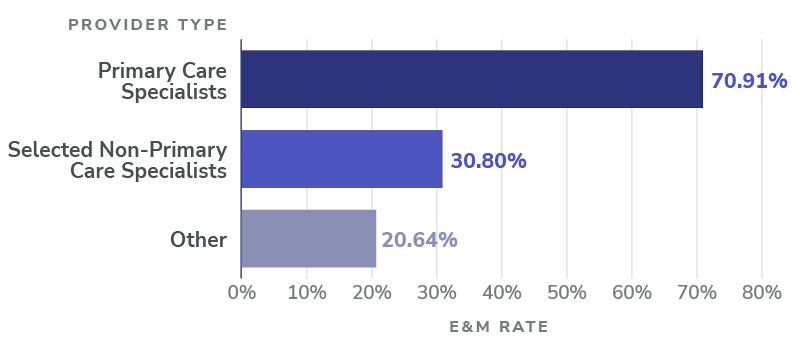
The chart below illustrates the non-facility E&M rates across different types of providers. Because PCC applies only to E&M services, the proportion of FFS revenue attributable to E&M services among Primary Care Specialists serves as a proxy for the portion of FFS revenue that will be replaced by PCC.
See a more detailed breakdown of our findings in Figure 1.
Breakdown by Region

In the chart below, we see that Primary Care Specialists in the Northeast, for example, have higher non-facility E&M rates, on average, than other regions. Since PCC applies only to E&M services, these regional variations in E&M rates will result in differences in how much of the total FFS revenue will be replaced by PCC.

E&M Spend by Claims-aligned Beneficiaries
Proportion of E&M Spend Attributable to Claims-aligned Beneficiaries
To arrive at this conclusion, we augmented our analysis of the Medicare PUF by estimating total FFS revenue and E&M FFS revenue from beneficiaries who are claims-aligned in performance year 2021, using 2019 claims data provided by CareJourney.
This data is additive because the Medicare PUF reports FFS revenue for all Medicare patients seen by a provider, but the CareJourney dataset allows us to filter for patients who would be claims-aligned to each provider.
For each provider, we computed the ratio of:

Where the numerator comes from CareJourney data while the denominator is based on the Medicare PUF. The distribution of this ratio is illustrated below.

If patients who are not claims-aligned to a provider choose to voluntarily align to said provider, it could boost the provider’s E&M revenue by about 22% under ACO REACH, since the PCC only covers E&M services provided to aligned beneficiaries.
Proportion of E&M Spend Billed by Provider for Claims-aligned Beneficiaries

We estimated this for each provider by computing the ratio of:

Where both the numerator and denominator are based on CareJourney data.
The distribution of this ratio is illustrated below in Figure 4.

If patients claims-aligned to a provider choose to receive all or the majority of E&M services from their aligned provider, this would eventually boost said provider’s E&M revenue in the following performance year.
To illustrate this with an example:
Table 2: Example patients and E&M spend
The ratio would be calculated as:
Using the example above, this means that if Patients 1 and 2, who are claims-aligned to provider Diane Chambers, received all their E&M services from Diane Chambers instead of also seeing provider Sam Malone, Diane Chambers would receive an additional $2,100 (B) in PCC revenue the following year.
In this post, we explained how much Fee-for-Service (FFS) revenue will be replaced by Primary Care Capitation (PCC) in the ACO REACH Model. In future posts, we’ll continue to use data science to provide insights in value-based care.
Pearl Health is powering the future of healthcare
We’re a team of physicians, technologists, and risk-bearing experts with a passion for enabling our partners to deliver better care and reduce health system costs. Want to learn more?